Oscilloscope Online
Advanced Web Serial Plotter with automation. Use any cheap MCU as a Digital Oscilloscope.
Tech Stack
TypeScript
NodeJS
Bootstrap
Jekyll
Docker
Actions
Technical Details
Overview
Oscilloscope Online is a lightweight, browser-based serial plotter powered by the Web Serial API. It enables anyone to visualize and monitor signals, sensor data, and other values directly from a microcontroller (MCU)—without needing costly oscilloscopes or complex data loggers.
Serving as a feature-rich alternative to the Arduino IDE Serial Plotter, it features a clean UI, high-performance and interactive charts via uPlot, and multiple export formats for superior real-time visualization.
Compatible with any serial device—including Arduino, ESP32, STM32, and Raspberry Pi—it supports research, sensor analysis, and hobbyist robotics projects.
Fully client-side and requiring no installations, Version 2 introduces advanced controls, enhanced customization, and automation features (e.g., special-character triggers for downloads and screen clearing) to streamline workflows.
Fast, versatile, and accessible, Oscilloscope Online makes professional-grade serial data monitoring simple and efficient.
Compatible with all Serial Devices
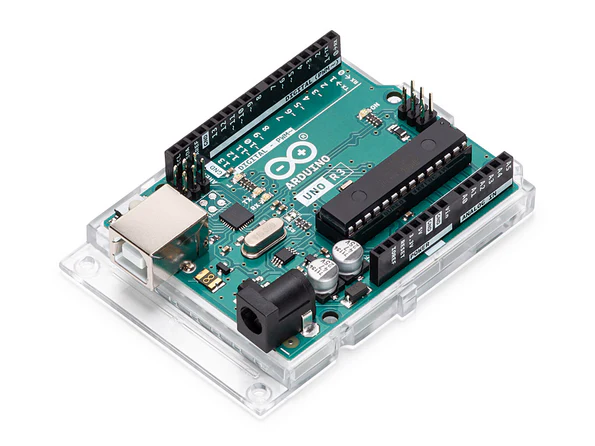
Arduino
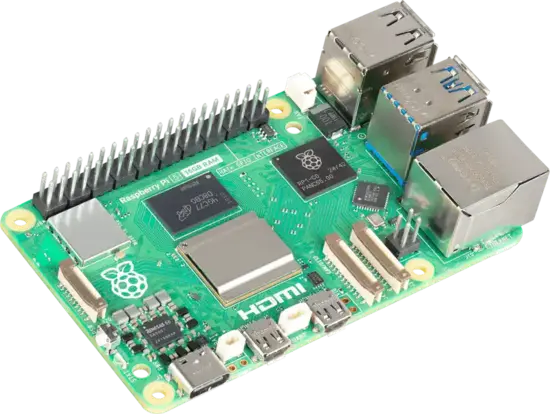
Rapsberry Pi
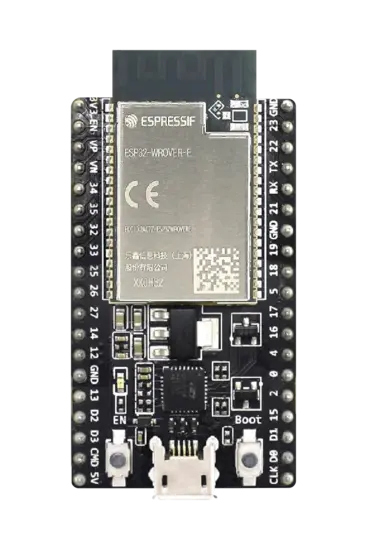
ESP32
Powerful Features of the Serial Plotter
Endless Options

Plug-and-Play
Export Formats
Where can you use it?

Research Work

Electronics Testing

Live Math & Variables
New Update!!
The project does not end here!! Version 3 is in the works and it will go above and beyond. You can expect it to offer the ability to plot charts from Audio, Mathematical/Programatic Expressions, Google Forms Responses, Javascript Code and Tabular Data on top of Serial Plotting.
Under the hood of V2
Build and Deployment
Usage Workflow
Share this page